The Best Metros for Minority-Owned Businesses in the U.S.

Share this article:
Editor’s note: Lantern by SoFi seeks to provide content that is objective, independent and accurate. Writers are separate from our business operation and do not receive direct compensation from advertisers or partners. Read more about our Editorial Guidelines and How We Make Money.
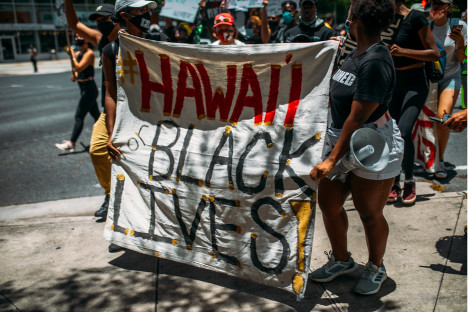
1. Honolulu, HI

Percentage of minority-owned businesses – 5 stars Sales from minority-owned businesses – 3 stars Immigrant population – 5 stars Revenue growth for people of color – 2 stars Inclusion of minorities – 5 stars Equity of minorities – 5 stars Diversity of population – 5 stars Prosperity among minority population – 5 stars
Small Business Spotlight: Jared Brown | Fat Cheeks
2. Cape Coral-Fort Myers, FL
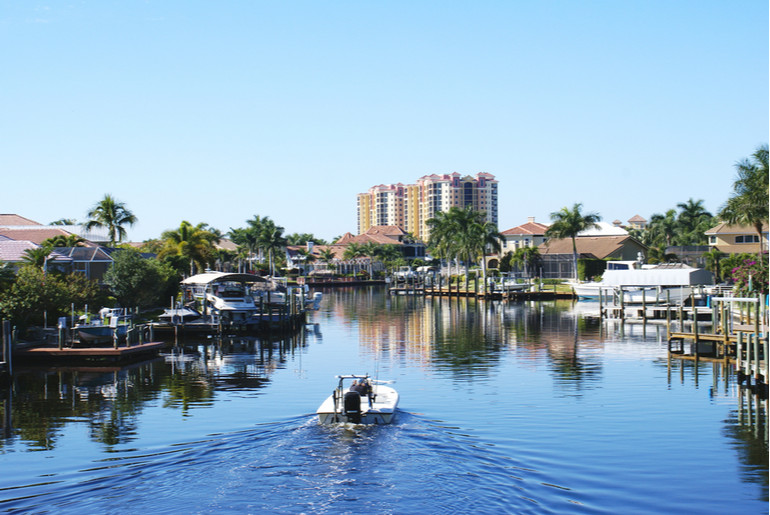
Percentage of minority-owned businesses – 5 stars Sales from minority-owned businesses – 5 stars Immigrant population – 5 stars Revenue growth for people of color – 2 stars Inclusion of minorities – 5 stars Equity of minorities – 4 stars Diversity of population – 4 stars Prosperity among minority population – 2 stars
3. Spokane-Spokane Valley, WA

Percentage of minority-owned businesses – 5 stars Sales from minority-owned businesses – 3 stars Immigrant population – 2 stars Revenue growth for people of color – 5 stars Inclusion of minorities – 4 stars Equity of minorities – 4 stars Diversity of population – 3 stars Prosperity among minority population – 3 stars
4. Palm Bay-Melbourne-Titusville, FL
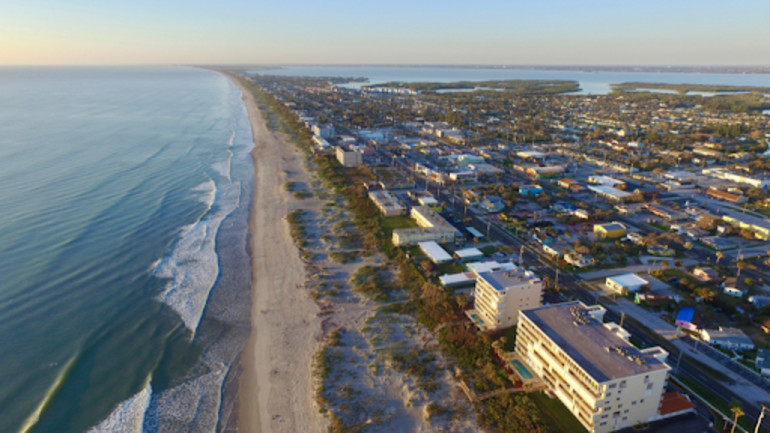
Percentage of minority-owned businesses – 5 stars Sales from minority-owned businesses – 3 stars Immigrant population – 3 stars Revenue growth for people of color – 2 stars Inclusion of minorities – 5 stars Equity of minorities – 5 stars Diversity of population – 4 stars Prosperity among minority population – 3 stars
5. Fresno, CA

Percentage of minority-owned businesses – 5 stars Sales from minority-owned businesses – 5 stars Immigrant population – 5 stars Revenue growth for people of color – 2 stars Inclusion of minorities – 5 stars Equity of minorities – 1 star Diversity of population – 5 stars Prosperity among minority population – 1 star
6. Des Moines-West Des Moines, IA

Percentage of minority-owned businesses – 5 stars Sales from minority-owned businesses – 3 stars Immigrant population – 3 stars Revenue growth for people of color – 3 stars Inclusion of minorities – 4 stars Equity of minorities – 4 stars Diversity of population – 3 stars Prosperity among minority population – 5 stars
7. Madison, WI
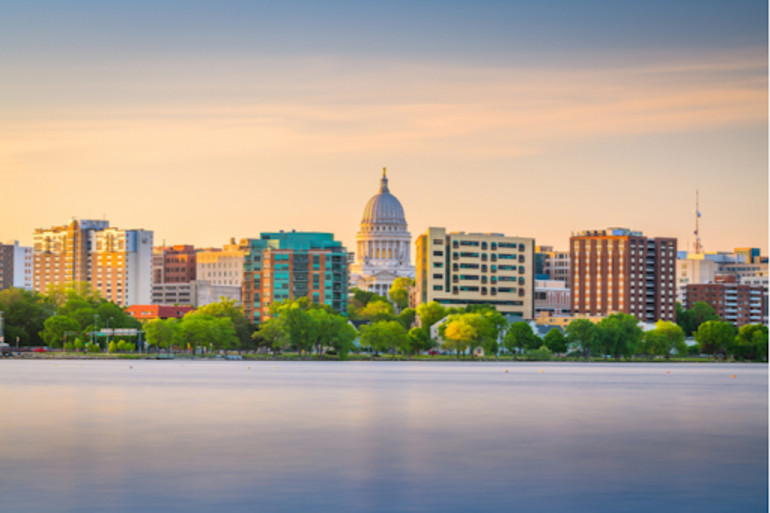
Percentage of minority-owned businesses – 5 stars Sales from minority-owned businesses – 1 star Immigrant population – 3 stars Revenue growth for people of color – 3 stars Inclusion of minorities – 1 star Equity of minorities – 3 stars Diversity of population – 3 stars Prosperity among minority population – 5 stars
8. Dayton-Kettering, OH

Percentage of minority-owned businesses – 5 stars Sales from minority-owned businesses – 3 stars Immigrant population – 1 star Revenue growth for people of color – 5 stars Inclusion of minorities – 3 stars Equity of minorities – 4 stars Diversity of population – 3 stars Prosperity among minority population – 2 stars
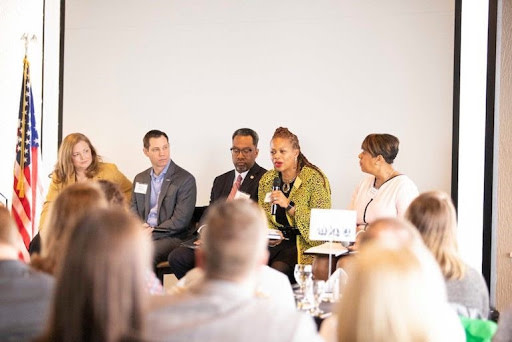
Small Business Spotlight: Dr. Karen Townsend | KTownsend Counseling
9. Knoxville, TN
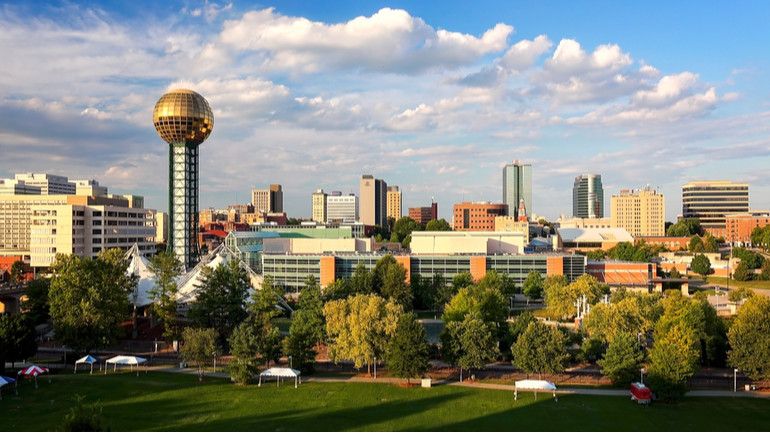
Percentage of minority-owned businesses – 5 stars Sales from minority-owned businesses – 4 stars Immigrant population – 1 star Revenue growth for people of color – 2 stars Inclusion of minorities – 3 stars Equity of minorities – 3 stars Diversity of population – 2 stars Prosperity among minority population – 3 stars
Small Business Spotlight: Sybil Bailey | Afro Mermaid Skincare

10. Akron, OH

Percentage of minority-owned businesses – 4 stars Sales from minority-owned businesses – 3 stars Immigrant population – 1 star Revenue growth for people of color – 3 stars Inclusion of minorities – 3 stars Equity of minorities – 4 stars Diversity of population – 3 stars Prosperity among minority population – 3 stars
Resources for Minority-Owned Businesses
Get Your Business Started Today!
Methodology
Median wage Unemployment Poverty Educational attainment Disconnected (not working or in school) youth School poverty Air pollution exposure Commute time Housing burden
White Black Latinx Asian or Pacific Islander Native American Mixed/other populations
Fair Use Statement
SOLC21020
About the Author
Kelly Doran is a professional writer and editor who is passionate about helping brands tell their story. Her extensive experience includes writing and editing long-form, quality content for enterprise organizations in Fintech, medical, and regulated industries.
Share this article: